
In a recent article, I provided a basic overview of technical indicators. I will continue here with a more detailed explanation of moving averages and how to use them to identify trends, as well as spot trend reversals, trend tops and trend bottoms.
Technical Indicators
Moving averages (MA), momentum indicators (MI) and relative strength indicators (RSI) are some of the technical indicators that analysts and investors use to evaluate price and volume trends. I use relative strength indicators only when I am trading across markets.
Moving averages can be calculated for periods of few days, hundreds of days or even longer. A moving averages graph generally will be a line along the price line that shows the trend of the current price relative to that moving average.
Momentum indicators signal the speed of price change, whether a trend is accelerating or decelerating, rather than the actual price level. While moving averages are lagging indicators, momentum indicators lead the price trend. They signal before the price trend begins to move. Momentum and moving average indicators work together. A momentum indicator will suggest a trend change, but the moving average indicator must confirm that trend change.
I only use momentum indicators when the moving average indicators for the short term and longer term conflict. This guide focuses on the more certain trade where both short- and long-term MA indicators agree.
Relative strength indicators signal how a sector or security is performing in terms of momentum comparing recent gains to recent losses. RSI can help indicate overbought or oversold conditions. One of the reasons it can be an important indicator is that it helps us identify the strong and weak performers in a certain segment.
Defining Trends
Traders try to identify the general trend of a security within the trading market. Three points connected along the price of the underlying security or market define a trend line. A trend line shows whether a market is heading higher or lower for the period covered by the trend line.
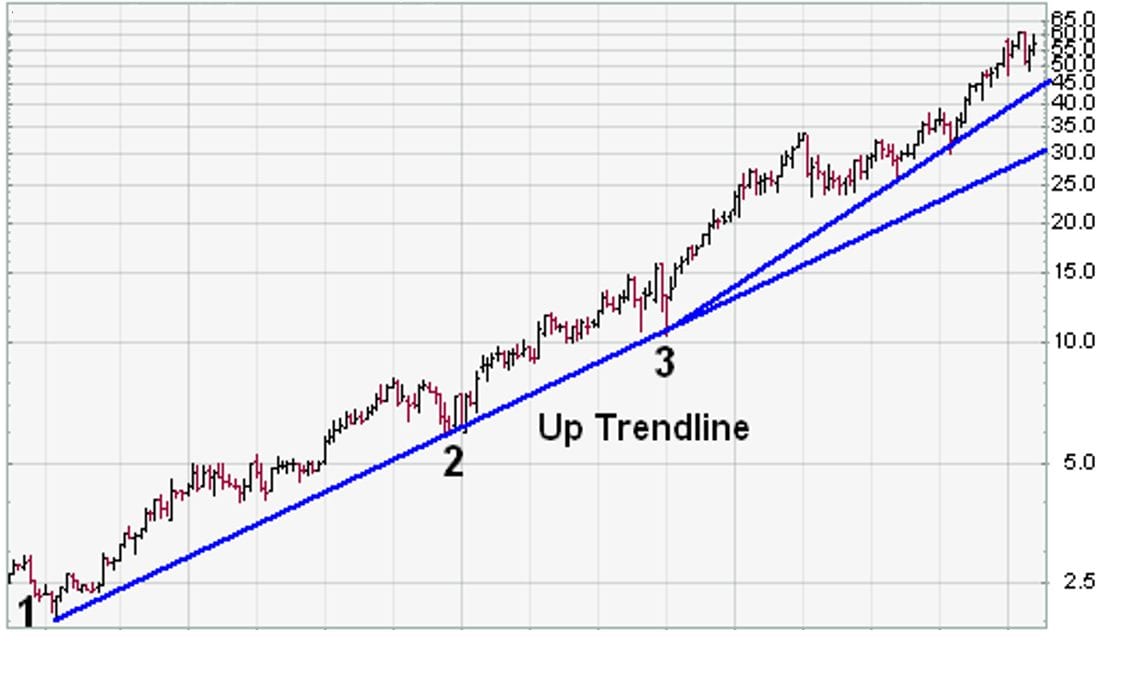
A trend line showing the bullish or upward price of EMC Corp over approximately 3 1/2 years.
Trend lines are easy to draw for strong up or down trends. When a market or a security is bouncing around in price but not climbing or falling over a given period, trends are much harder to discern. That is called a non-trending or neutral market.
Trend channels are like trend lines, but with a top and bottom channel for clearly defining the range of price movements along the support and resistance levels.
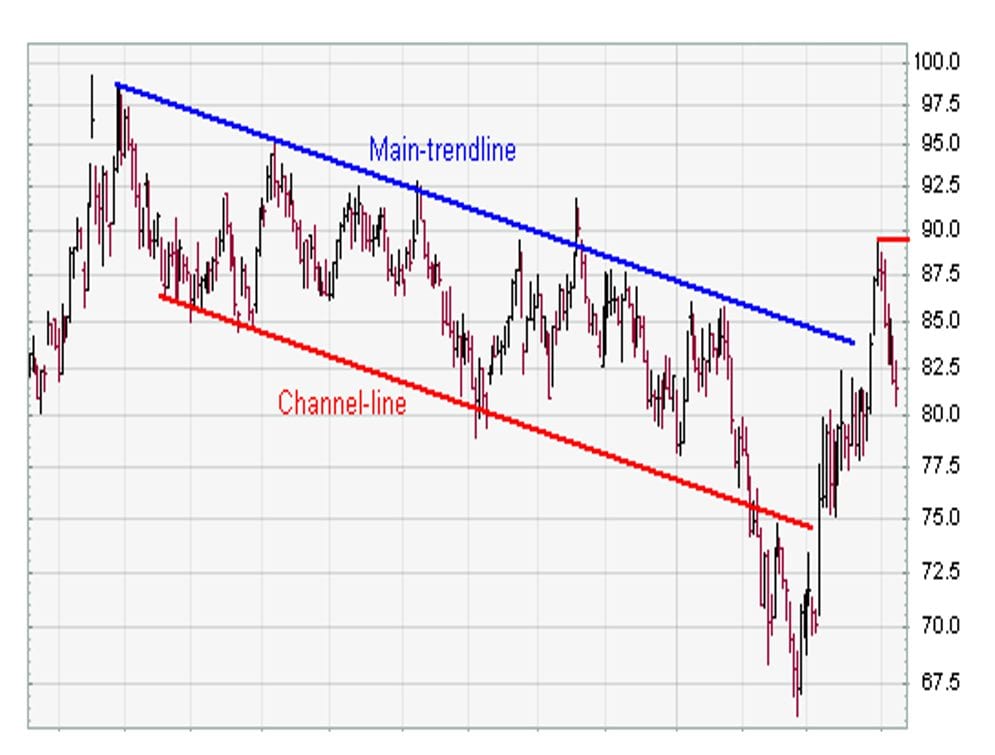
While trend lines and trend channels may seem outdated compared to the current high-speed trading software, they still allow traders to spot longer-term trends.
Spotting Reversals
Spotting reversals involves comparing the price action against several indicators. The price either will go above or below the 20-day moving average (DMA) line or shorter-term MA. This is an early indicator of at least a short-term trend change. Short-term trend changes are often long enough for option trades expiring in a month or two. The full confirmation of a trend change generally occurs when the price action crosses the 200 DMA.
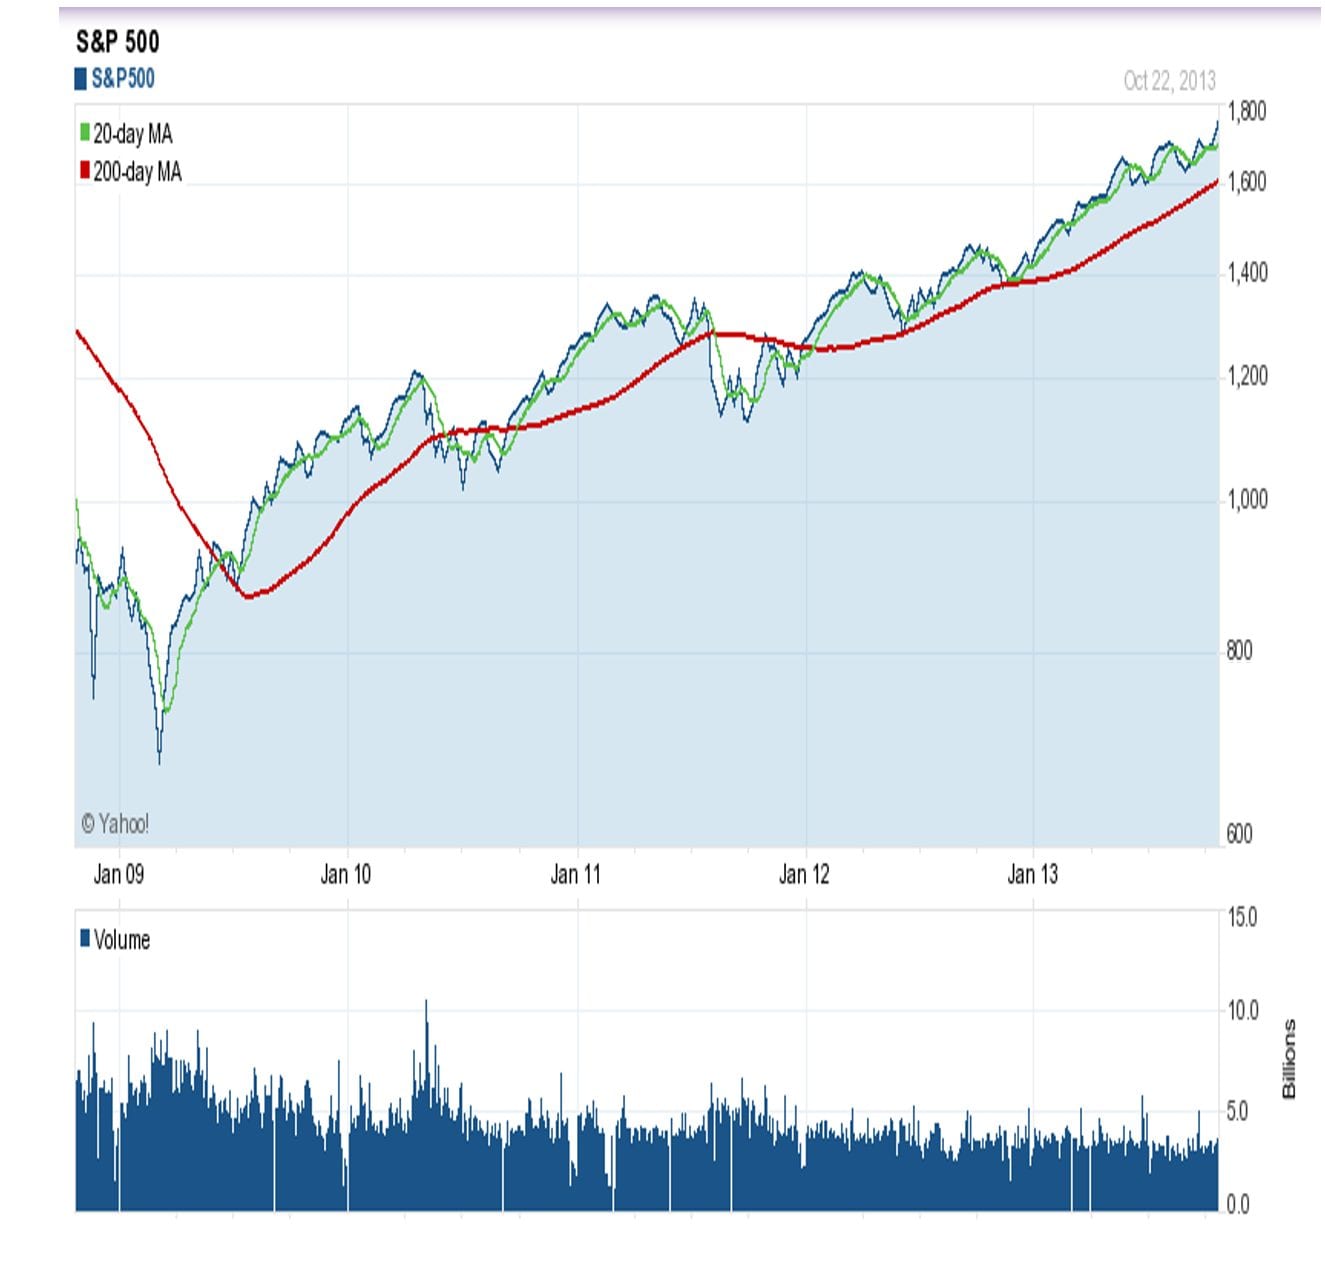
The green line shows the 20 DMA. It revealed the trend reversal months before the 200 DMA confirmed it. Notice how the 20 DMA can fake a trader out to either the up or down side, but the 200 DMA rarely sends a fake signal.
Analysts use different time frames to identify a reversal or trend change confirmation, but the 200 DMA is widely used and it has been relatively reliable. As the example above shows, the S&P 500 crossing the 200 DMA marked a definite trend reversal from a bearish and neutral market to a bullish market.
While spotting reversals can be a great form of options trading, you have to be correct 52% of the time when trading straight calls or puts. Trading option spreads will increase your odds dramatically because you are no longer limited to only the long or short side of trading. You can make money just as easily, and often with less risk, by trading neutral, non-trending markets, without having to spot potential reversals.
Tops and Bottoms
Tops and bottoms mark the price points where trends reverse direction and are extremely difficult to spot. Many investors attempt to time their trades to align precisely with market tops or bottoms.
The downfall of many who attempt to guess the tops and bottoms accurately gave us the funny market saying “Bulls make money and bears make money, but pigs get slaughtered”. The pig is the person who craves that last dollar in the transaction and wants to pick the exact top or bottom for a given trade.
While the tools I provide here will help greatly to anticipate market tops and bottoms, absolute accuracy is not only difficult, it is unnecessary.
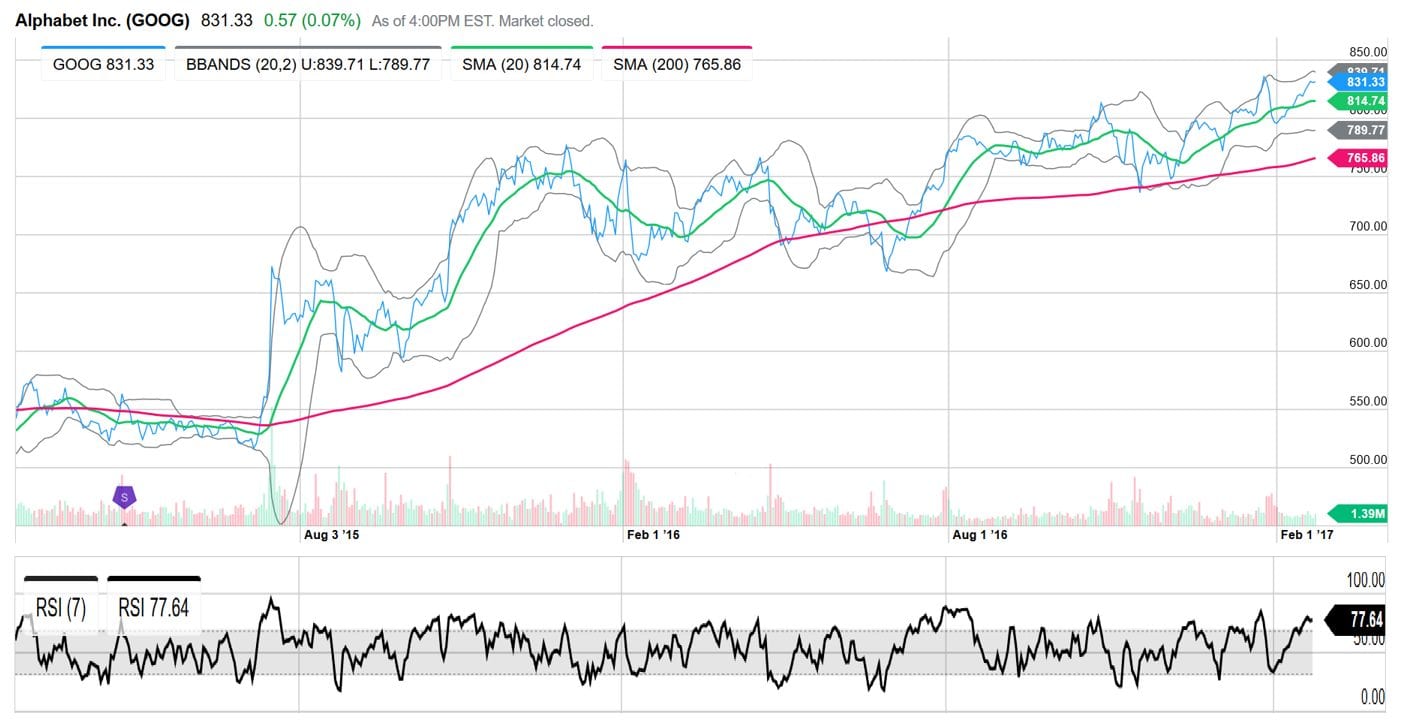
Picking a top requires monitoring the price and volume of the security. For example, the chart below shows both price and volume for GOOG.
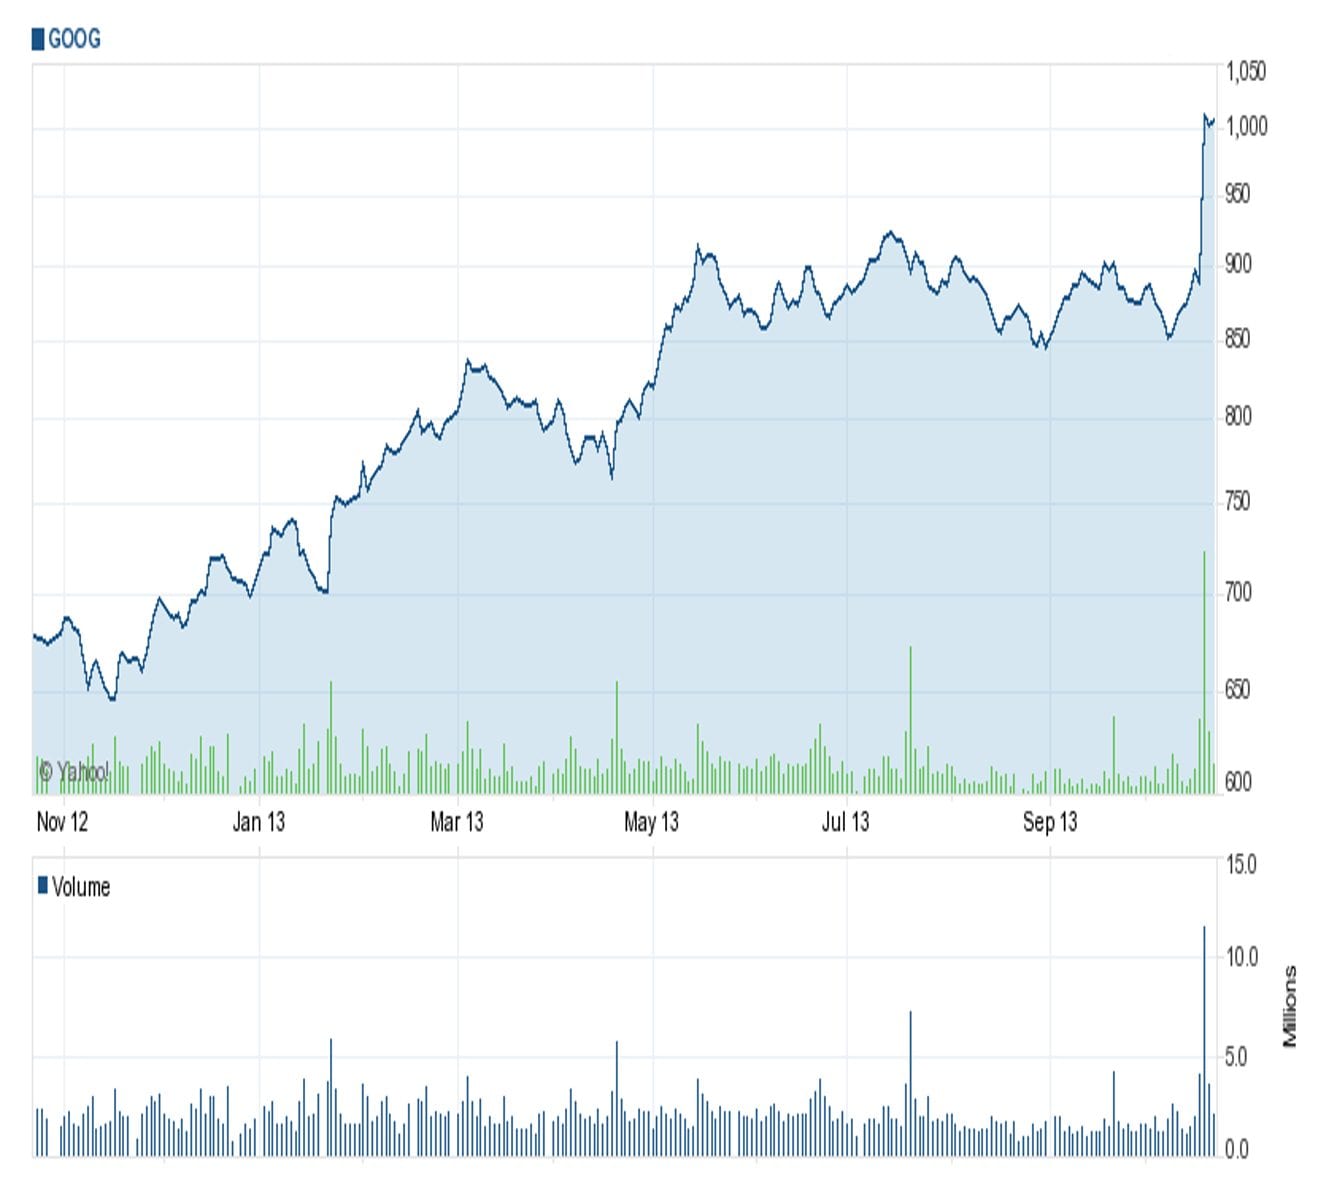
When volume is rising, price will tend to rise. If the volume peaks and the price continues to rise, that strongly suggests that a reversal to the downside is coming.Spotting a bottom in any market is the reverse of spotting a top, with a few wrinkles thrown in.
If a securities price has been dropping while the volume is picking up, this strongly suggests that there will be a reversal to the upside shortly. Looking at the GOOG chart above, it also shows that there are rarely volume spikes to the downside. Just after a major price drop, there can be volume spikes as bargain hunters sweep in and begin bidding up the stock. That stampede marks a reversal.
Signals
Additional signals for determining tops and bottoms include a simple method of checking for repeated attempts at breaking either support or resistance. If a security attempts to break through previous resistance and fails on the third attempt, there is a strong chance that the price will head down hard immediately after the third attempt. The same tendency applies to bouncing through support levels.
Here is the support and resistance chart showing this pattern:
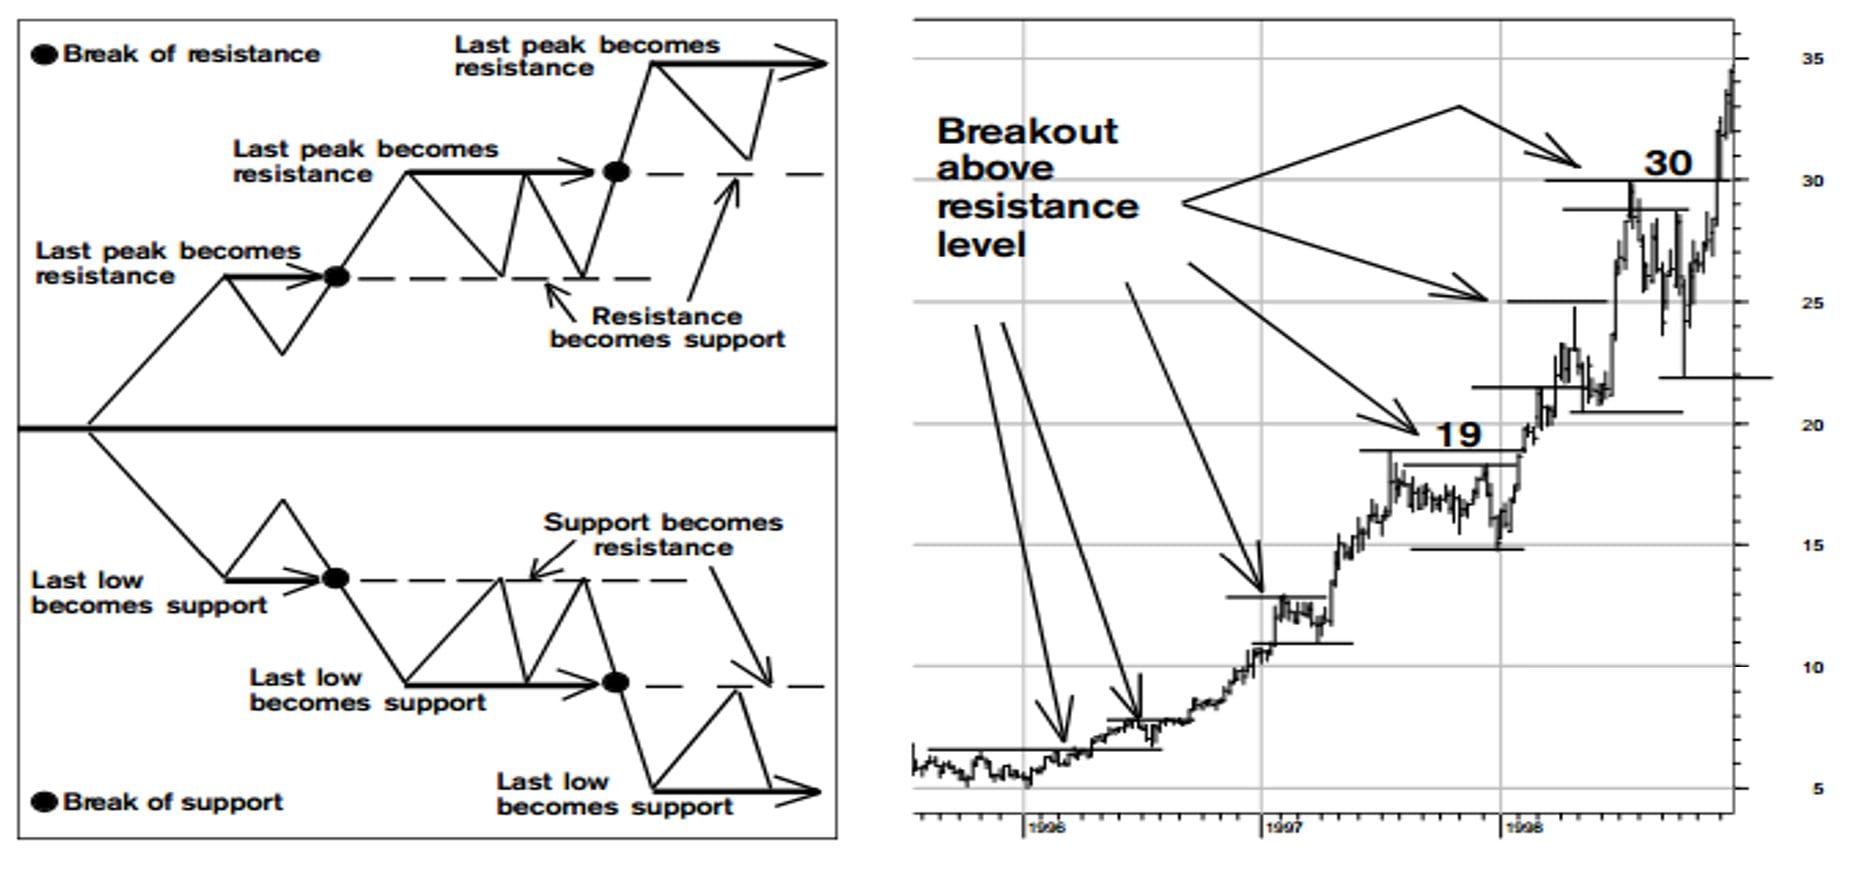
The break of resistance shows a continuation of a bullish trend. If instead of breaking resistance, the price backs off from the resistance line, a top is often reached. The same applies to a price bouncing off support three times for defining a bottom. If a securities price bounces off support three times, it has probably bottomed for the time period and is heading higher in a new trend pattern.
The three-touch rule might sound simple, but you will be amazed at how reliable and repeatable this technical indicator is.

Billy Williams is a 25-year veteran trader and author. For a free strategy guide, “Fundamentals for the Aspiring Trader”, and to learn more about profitable trading, go to www.stockoptionsystem.com.