What is an Option Chain? How Do You Read Option Quotes?

Cole Turner

Option chain

An option chain is a matrix listing for a single underlying security that shows all of the available option contracts.

Advertisement.

Essentially, an option chain is a list of all the call and put options available for trading a particular underlying security, such as a stock. It is crucial that investors are able to read option chains so that they can make informed decisions when trading options.

Online brokers and stock trading platforms display option quotes row by row within the option chain by using real-time or delayed data.

The best way to understand how to read an option chain is actually to look at one and learn what the language means.

Advertisement.

Let’s look below at an option chain for Microsoft (NASDAQ: MSFT).

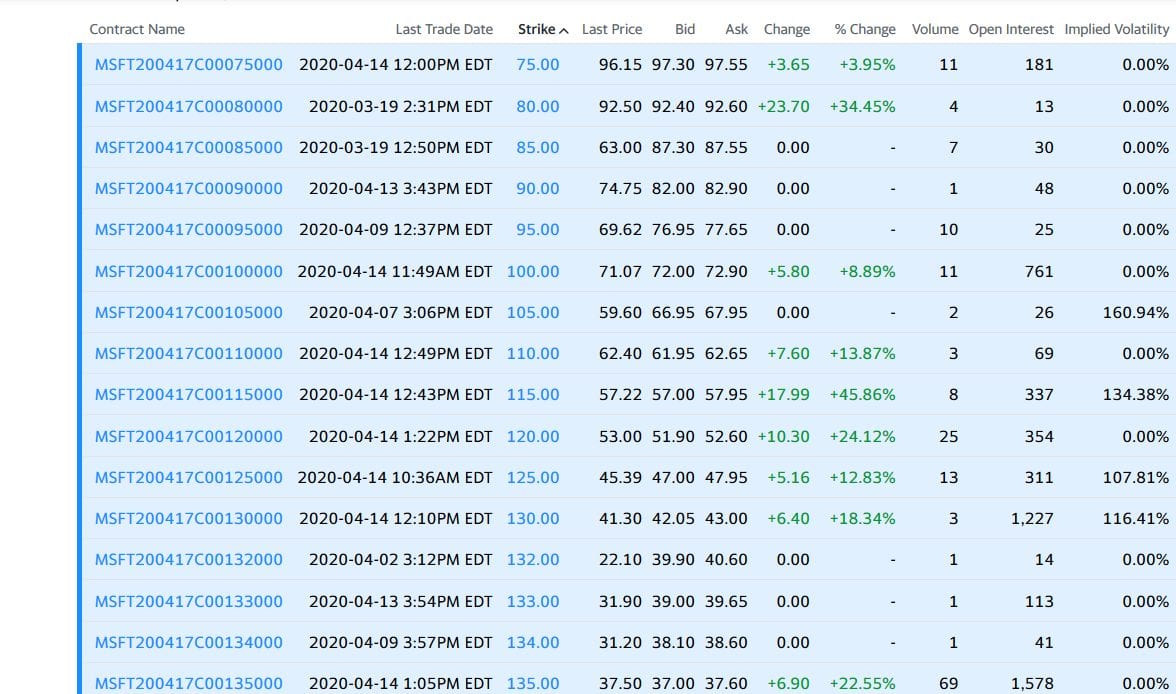
This picture only shows shaded call options. If you were to scroll down farther on this option chain, then you would find put options as well. The options are shaded because that indicates that these options are “in-the-money.” Options that aren’t shaded indicate that they are “out-of-the-money.” This chain deals with options that expire in a day. Now let’s look at this chain one column at a time.

The first column lists the different trading symbols for each call option. Each symbol represents which stock this option belongs to, when the option expires, if it is a call or put option and the strike price. Let’s look at the symbol, “MSFT200417C00135000.” “MSFT” means that the underlying stock of this option is Microsoft. “200417” means that this option is expiring on April 17, 2020. “C” indicates it is a call option. “00135000” indicates that the strike price is $135.

Advertisement.

The second column indicates the time at which the last trade of the particular option took place.

Exclusive  The Basics of Option Pricing – How to Understand It

The third column is the strike price. That is the price at which the owner of the call option has the right to buy the underlying security until the expiration date.

The fourth column is the last price at which the option was traded. This price may not reflect the current market price, so the buyer must beware.

The fifth column is the bid price. That is the price at which the option buyer is willing to pay for the option.

The sixth column is the ask price. That is the price at which the option seller is willing to sell the option.

Advertisement.

Also keep in mind one option contract equals 100 shares of stock. Whatever the bid or ask price is should be multiplied by 100 to get the actual price of the option contract.

The seventh column labeled “change” is the difference between the current price of the option and the previous day’s closing price of the option.

The eighth column is the percentage change of the current price minus the previous day’s closing price.

The ninth column is the volume of the contract. That is the number of contracts of that particular option that were traded on that day.

The 10th column is open interest. Open interest is the total number of contracts that are still outstanding. This means that these contracts have been traded but have yet to be exercised, closed, or expired.

The 11th column is the implied volatility. Implied volatility is used to indicate how volatile a stock’s price may be in the future. High implied volatility means that the market predicts that the stock will have large price swings in either direction. Low implied volatility means that the market predicts that the stock will not swing in either direction significantly.

Advertisement.

Implied volatility is important in the pricing of option contracts. Higher implied volatility indicates a higher premium price, whereas a lower implied volatility indicates a lower premium price.

Exclusive  Stop Loss Order vs Stop Limit Order – What Is It?

After having read this article, one should be feel prepared to read an option chain and understand what each column means. This is a critical skill needed in order to become a successful options trader.


share on:

Like This Article?
Now Get Mark's FREE Special Report:
3 Dividend Plays with Sky-High Returns

This newly-released report by a top-20 living economist details three investments that are your best bets for income and appreciation for the rest of the year and beyond.

Get Access to the Report, 100% FREE


img
share on:

PREMIUM SERVICES FOR INVESTORS

Dr. Mark Skousen

Named one of the "Top 20 Living Economists," Dr. Skousen is a professional economist, investment expert, university professor, and author of more than 25 books.

Product Details

  • Forecasts & Strategies
  • Home Run Trader
  • Fast Money Alert
  • Five Star Trader
  • TNT Trader
LEARN MORE HERE

Bryan Perry

A former Wall Street financial advisor with three decades' experience, Bryan Perry focuses his efforts on high-yield income investing and quick-hitting options plays.

Product Details

  • Cash Machine
  • Premium Income PRO (exclusively for subscribers of Cash Machine)
  • Quick Income Trader
  • Breakout Options Alert
  • Hi-Tech Trader
LEARN MORE HERE

Jim Woods

Jim Woods has over 20 years of experience in the markets from working as a stockbroker,
financial journalist, and money manager. As well as a book author and regular contributor to
numerous investment websites, Jim is the editor of:

Product Details

  • Successful Investing
  • High Velocity Options
  • Intelligence Report
  • Bullseye Stock Trader
  • Eagle Eye Opener
LEARN MORE HERE

Bob Carlson

Bob Carlson provides independent, objective research covering all the financial issues of retirement and retirement planning. In addition, Bob serves as Chairman of the Board of Trustees of the Fairfax County (VA) Employees’ Retirement System, which has over $2.8 billion in assets.

Product Details

  • Retirement Watch
  • Retirement Watch Spotlight Series
  • Lifetime Retirement Protection Program
LEARN MORE HERE

Jon Johnson

Jon Johnson's philosophy in investing and trading is to take what the market gives you regardless if that is to the upside or downside. For the past 21 years, Jon has helped thousands of clients gain success in the financial markets through his newsletters and education services:

Product Details

  • Investment House Daily
  • Stock of the Week
  • Technical Traders Alert
  • Rapid Profits Stock Trader
LEARN MORE HERE

DividendInvestor.com

Used by financial advisors and individual investors all over the world, DividendInvestor.com is the premier provider and one-stop shop for dividend information and research.

Product Details

Popular tools include our proprietary Dividend Calendar, Dividend Calculator, Dividend Score Card, and many more.

  • Dividend Investor
LEARN MORE HERE

George Gilder

George Gilder is the most knowledgeable man in America when it comes to the future of technology and its impact on our lives.  He’s an established investor, bestselling author, and economist with an uncanny ability to foresee how new breakthroughs will play out, years in advance.

Product Details

  • Technology Report
  • Technology Report PRO
  • Moonshots
  • Private Reserve
  • Millionaire Circle
LEARN MORE HERE

DayTradeSPY

DayTradeSPY was founded by head trader Hugh Grossman, a retired internal auditor for a Fortune 500 company. After years of first-hand experience trying out one trading strategy after another, Hugh instead developed his own trading system centered around day trading SPY options. That’s it... Nothing else.

Product Details

  • Trading Room
  • Pick of the Day
  • Inner Circle
  • Online Workshops
LEARN MORE HERE