The major averages plumbed to new lows for 2018 as heightened concerns of global growth is going to wash up on America’s shores and pull the economy down next year.
Plus, fear exists among some investors that the Fed is out of touch with how the United States is tethered to Europe and Asia, where the latest data show a slowing of economic activity. The S&P 500 broke two key technical support levels, first at 2,600 and then the February low of 2,530.
The collateral damage thereafter was further selling pressure that has the index trading down to 2,450 and the worst week for the market in nine months. Clearly, the Fed’s actions triggered the latest round of selling, but the psychology surrounding the macro risks (slowing in Europe and Asia) and sentiment has swung to being bearish as the year comes to a close
However, one indicator, known as the put-call ratio, spiked to a historic level of 0.97 yesterday on headlines that the government shutdown is a very real possibility. The put–call ratio is a popular tool used by investors to gauge the overall sentiment (mood) in the market.
The ratio measures how many put options are being traded relative to call options. The put–call ratio is calculated by dividing the number of traded put options by the number of traded call options.
Clearly, the oversold condition likely will prompt a snapback rally, which will offer up an opportunity to lighten up on long positions and add some portfolio insurance to hedge from what likely will be a move lower to the next major support level. That prospect looks highly likely, given the defined downtrend that is now in place.
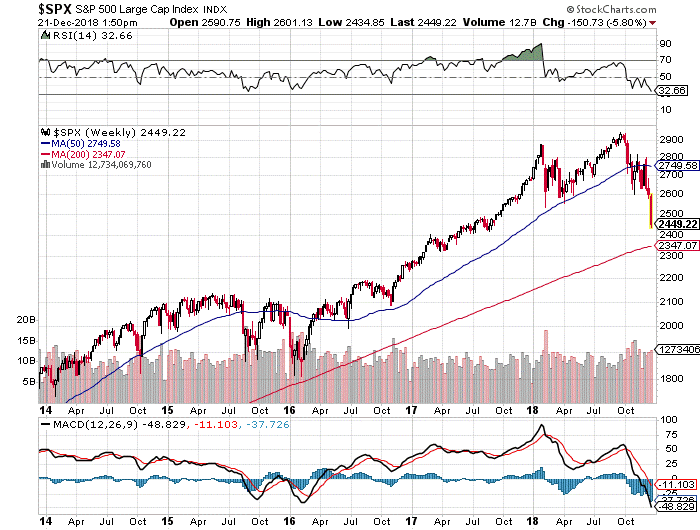
How low can the market go? Well, looking at the five-year chart of the S&P 500, which is the stock market’s key benchmark, the next major level of technical support is 2,350, per the chart below. This would represent another 5.2% downside in the current move which would take the S&P into bear market territory or find an institutional bid for the market. We won’t know until we get there. By most indicators, it looks like that level will be tested.
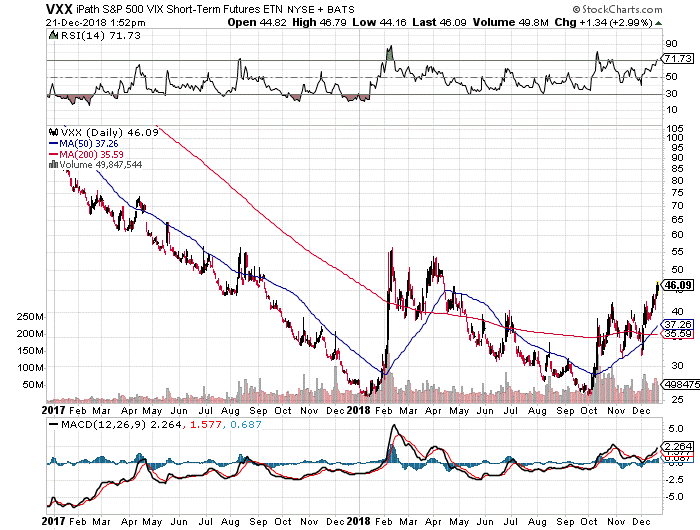
Assuming this scenario plays out, there are two highly liquid instruments that stand to outperform. One is the iPath S&P 500 VIX Short-Term Futures ETN (VXX), which is an Exchange Traded Note backed by Barclays Bank. Shares of VXX are designed to provide access to equity market volatility through CBOE Volatility Index (the “VIX Index”) futures. VXX offers exposure to a daily rolling long position in the first and second month VIX futures contracts and reflects market participants’ views of the future direction of the VIX index at the time of expiration of the VIX futures contracts comprising the Index.
The market cap of VXX is $747 billion with average trading volume greater than 50 million shares per day. Currently trading at $45, VXX shares can trade significantly higher, per the two-year chart, below depending on the scale of the current correction and the speed with which the market challenges its next support level. This is a very effective way for investors to not just bet on further declines for the market, but also a highly useful way to hedge stock portfolios that are long in the market.
The other instrument of choice to profit from in a market sell-off is to buy the iShares 20+ Year Treasury Bond ETF (TLT), which is a pure play on lower long-term Treasury yields as the flight to safety puts tremendous downside pressure on long-term interest rates. It should also be noted that longer-term bonds are more price sensitive to interest rate movements and guidance from the Fed.
And investment in TLT shares seeks to track the investment results of the ICE U.S. Treasury 20+ Year Bond Index (the “underlying index”). The fund generally invests at least 90% of its assets in the bonds of the underlying index and at least 95% of its assets in U.S. government bonds. The underlying index measures the performance of public obligations of the U.S. Treasury that have a remaining maturity greater than twenty years. The fund has an expense ratio of 0.15%.
This is the only ETF that offers exposure to longer-term treasury bonds. In fact, out of all ETFs offering exposure to the Treasury market, TLT has the highest average trading volume of 9.06 million. This makes it easier to buy and sell shares in the ETF, thereby lowering the liquidity risk when investing in the fund.
I believe that current Fed policy will keep short-term treasury yields higher, and increase market expectations of a potential recession in the future, which will cause longer-term yields to fall. In this case, this would support the inversely correlated long-term bond yields higher, and consequently allow the TLT ETF to rally higher. The Fed did not lower its projections as much as the markets expected. For instance, they stated they would lower their projections from three to two rate hikes for 2019, which upset markets that were trading on the notion of preparing for no rate hikes at all next year.
When long-term Treasury bond yields were at their lowest in mid-2016, shares of TLT traded as high as $144. Today, they trade at $121, or 19% lower. It’s my position that market sentiment toward long-term rates moving lower will continue to rise, and with it, the price of TLT shares will appreciate as well. Slowing global growth, political instability and fear of capital erosion have gripped the market. Getting long in the VXX and TLT is one way to put a floor under further downside risk.
Reducing market exposure over the short-term will be a focus of fund managers going forward and any Santa Claus rally that emerges will provide an opportunity to raise cash and look for the market to establish a true bottom. The market has spoken, and investors should adjust to the path forward to manage out of weaker long positions and add more inverse ETFs that hedge from further capital erosion.

![[instant messaging via tablets and phones]](https://www.stockinvestor.com/wp-content/uploads/shutterstock_125411345.jpg)