The most important data point for stock market investors now is the yield on the 10-year Treasury Note.
How it trades up or down determines the response of the algorithmic trading programs as they adjust to the short-term direction of the equity markets. A poorly received seven-year Treasury auction is the culprit for the recent volatility — it revealed much about just how sensitive investor sentiment is to rising rates.
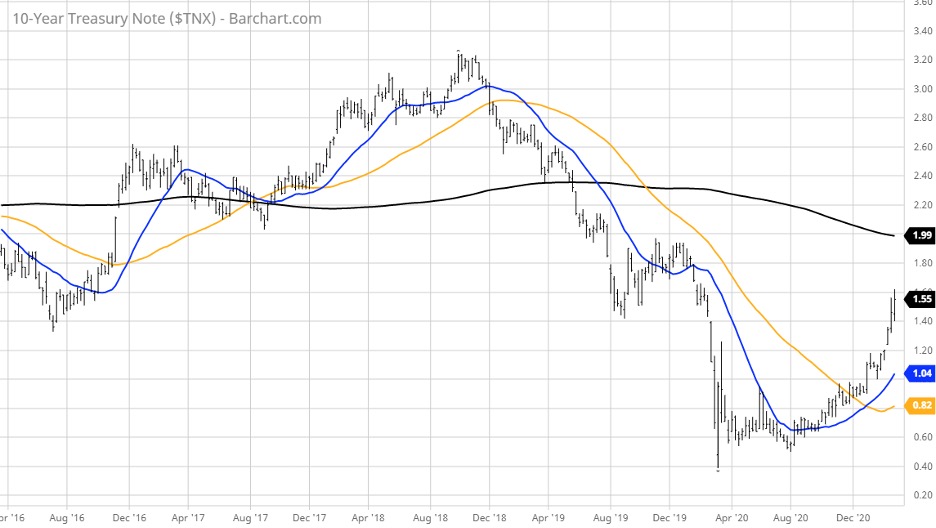
Seeing the benchmark yield adjust from 0.90% on Jan. 1 to last week’s close at 1.55% shouldn’t be considered out of the ordinary, considering the more optimistic view of the economy, but the speed at which the yield rose did not sit well with the market. The five-year chart of the 10-year yield (below) shows some technical resistance here, then vulnerability to an extended move up to 1.90% if future bond auctions fare poorly.
Today, the Treasury will auction off $58 billion in three-year Notes, then $38 billion in 10-year Notes on Wednesday, then $24 billion in 30-year Bonds on Thursday as well as 10-year Treasury Inflation-Protected Securities (TIPS) on Thursday.
Of the four auctions, I imagine the 10-year TIPS will be vastly oversubscribed. Investors are hearing more about inflation and this week’s reading on the February Consumer Price Index (0.4% consensus estimate) and Producer Price Index (0.6% consensus estimate) will be just as closely watched as the bond market’s reaction to the various auctions. Similar to the year-over-year earnings comparisons, next week’s inflation data will appear much stronger at first glance, considering the depressed levels at this time last year.
The problem a lot of market pundits fear is that Fed Chairman Powell and his colleagues are going to fall behind the curve, painting themselves into a corner. Powell’s stated fiscal quantitative easing (QE) goal is still coming at the rate of $120 billion per month. Fed officials have made it clear that they won’t be raising rates anytime soon and that the Fed isn’t going to be cutting back on its asset purchases for the balance of 2021.
The Fed might be empathically holding the line on its list of current policies, but it’s what the market thinks that ultimately matters, and Powell shouldn’t be “playing chicken” with the bond vigilantes. (For those not familiar with this term, economist Ed Yardeni coined the term “bond vigilantes” in the 1980s, referring to investors who sell bonds in protest of monetary policies, thereby driving up yields.)
The Fed should not provoke this crowd. They make the Wall Street Bets community look like child’s play in the size and scope of the influence they have on both the bond and stock markets, both here and abroad. The persistence of low long-term rates has been driving asset inflation for years, and the Fed made known to the investing world their willingness to be flexible amid rising inflationary conditions.
It’s not that the Fed won’t use its toolbox to tamp down long-term yields if they start to get disorderly. Rather it is Chairman Powell’s unwillingness to discuss some of these options, such as utilizing “Operation Twist,” the selling of short-term Treasuries and buying of long-term Treasuries to flatten the curve and satisfy the market’s need for a Fed sensitive to inflation.
Powell labels the rise in inflation as “transitory,” meaning temporary, with limited staying power. During a Senate committee hearing last Wednesday, for instance, Powell said, “We could have a surge in spending as the economy reopens. We don’t expect that to be a persistent longer-term force, so while you could see prices move up, that’s a different thing from persistent high inflation, which we do not expect,”
Though consumer prices were up just 1.4% from a year ago in January, recent indicators — such as rising retail sales, durable goods purchases and service sector prices — have shown more inflation to be in the pipeline. The five-year breakeven rate, an indicator of the bond market’s expectations for inflation, rose to 2.38% as reported last Wednesday to mark its highest level since before the financial crisis of 2008.
This line of thinking is what investors fear most in a recovery — that inflation is picking up from global supply/demand dislocation in commodities and the service sector amid week-to-week upward revisions for gross domestic product (GDP) growth. The latest employment report added fuel to the case for the Fed to start the discussion of a forward response plan, in the event that both inflation and economic data trend persistently higher.
Come this time next week, with a few more Treasury auctions over and key inflation data having crossed the tape, investors should have a better idea of whether the bond market overreacted or the current rotation out of Treasuries is warranted. The bigger question is whether the stock market can successfully transition to higher earnings growth and higher rates. History is resoundingly on the side that it will.
It may also be instructive to look at some historical examples of rising interest rate environments.*
- From 1954 to 1960, the 10-year Treasury yield went from 2.3% to 4.7%. At that time, the S&P 500 was up 207% in total return (17.4% annualized).
- From 1993 to 1994, rates shot up from 6.6% to 8.0%. The S&P 500 was still up nearly 12%.
- At the tail end of the dot-com Bubble, rates rose from 5.5% in 1998 to 6.5% in 1999. Stocks were up more than 55%.
- From 2003 through 2007, rates went from 3.3% to 5.1%. The S&P rose nearly 83% (12.8% annualized).
- The latest rising rate environment saw the 10-year rate go from 1.5% in 2012 to 3% by 2018. Even with the mini-bear market at the end of 2018, stocks were still up 131% in total.
*Source: www.awealthofcommonsense.com
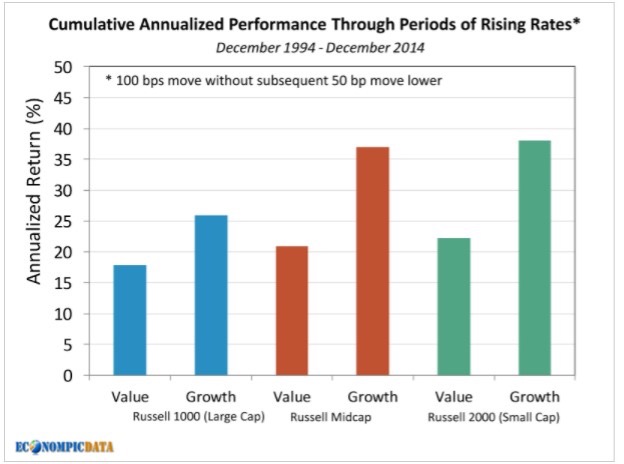
The stock market generally holds up well when rates are rising. EconomPic ran the numbers on what happens to various segments of the U.S. stock market historically when rates rise 1% or more during a 10-year span — during a 20-year span including the 1999-2000 dot-com bust and the 2008-09 Great Recession.