
There are a lot of indicators to watch in the market. There are moving averages, price-to-earnings ratios, relative strength ratings, earnings per share (EPS) growth rates, stochastics, Bollinger bands — and even something called a Fibonacci.
While most market indicators are useful in their context, sometimes there are indicators that give off a perplexing warning sign that becomes an interesting metric to track during a potential market pivot. Today, that indicator is the market dynamic that is the historical inverse correlation between the broader stock market (S&P 500 Index) and the CBOE Volatility Index (VIX).
The following analysis of the VIX appeared Tuesday morning in the inbox of subscribers to my Eagle Eye Opener daily market briefing. Here, my “secret market insider” provided us with this deep dive into what the VIX is telling us right now. So, if you want this kind of insight sent to you each morning at 8 a.m. Eastern, then you must subscribe to Eagle Eye Opener today!
Since markets bottomed in March 2009, the S&P 500 and the VIX have consistently maintained an inverse correlation, with the volatility index typically drifting steadily lower as equities powered to new highs (think 2017, when the VIX fell into single digits amid steady stock market gains) while bouts of volatility and short-lived selloffs in the stock market saw the VIX spike higher. Digging into this relationship deeper, when stocks made new meaningful lows below notable support levels, the VIX would almost always rise to new highs beyond those that corresponded with the previous lows in stocks.
For example, as the S&P 500 dropped below the lows from late 2018 (2,346) during the Q1 ’20 COVID-19-crash, which carried the index down to 2,191, the VIX blasted through the late-2018 high of 36.20 and peaked at a staggering 85.47. The uncertainty associated with the first pandemic in 100 years certainly amplified the move higher in the VIX in that example, but it does illustrate the point of the traditional inverse correlation between stocks and the VIX very well.
Now, the actual formula and process used to calculate the VIX is very complex and involves some high-level math, but in the simplest terms, the index measures price activity, mainly demand, in the options market. That is why in normal market conditions, the VIX rises amid increasing demand for puts as the broader stock market declines, and this also the reason it is often referred to as the markets “fear gauge.”
So, when “smart money” is adding hedges to long equity positions in an attempt to limit drawdowns and reduce portfolio risk, the VIX rises with the increasing demand in the options market. This occurs regularly during periods of volatility in secular bull markets, as investors prefer to avoid selling positions outright for tax reasons.
In normal bull markets, new lows in the S&P 500 are almost always met with new highs in the VIX (with a few outlier exceptions such as the “VIX-mageddon” event in early 2018). As the market recovers and smart money reduces those hedges, the VIX tends to retreat, often quite rapidly.
But at both of the most recent major market peaks that occurred in 2000 and then again in 2007/2008, that historically consistent inverse correlation between the stock market and the VIX broke down as new meaningful lows in the S&P 500 were not met with new highs in the VIX. And it has happened again this year.
The logical question to ask here is: why would this happen?
At first glance, it makes no sense as to why a widely followed, broad-market volatility indicator would just suddenly stop functioning as it has for the last decade. However, as we have noted over the course of the year, there is a likely explanation for making sense of a breakdown in the relationship between the S&P 500 and the VIX.
As stocks make new meaningful lows, as they first did in February, then again in May and June of this year, we believe sophisticated investors were actually liquidating long-term, long equity positions as opposed to holding those positions and just adding hedges to manage risk and downside exposure as was discussed above. When there is “real” selling and liquidation going on by sophisticated investors, most of them are also unwinding hedges, which, in its simplest form, means the net selling of put protection (although some hedging strategies are very complex and go well beyond simply holding single strike puts) and therefore keeping pressure on the VIX per its complex calculation of demand for options.
So, what we are seeing in cross-asset analysis with the VIX and the S&P 500 right now is the same thing we saw in both 2000/2001 and 2007/2008 in the early stages of those respective bear markets. And the bad news is that this dynamic only persists during the “distribution phase” of market cycles when sophisticated investors are liquidating to retail investors attempting to “buy one more dip.” Once the VIX finally breaks the downtrend of “lower highs” and begins to move meaningfully higher, the real breakdown and capitulation in stocks begins.
Looking at the dot-com bubble, the downtrend in the VIX was broken in September 2001, and the S&P 500 proceeded to decline another 30% or so, as the VIX ripped higher, before finally bottoming in late 2002. During the financial crisis, the VIX downtrend was not broken until September 2008, and the S&P 500 fell another 47% to the March 2009 lows (of course, the VIX ripped higher as well).
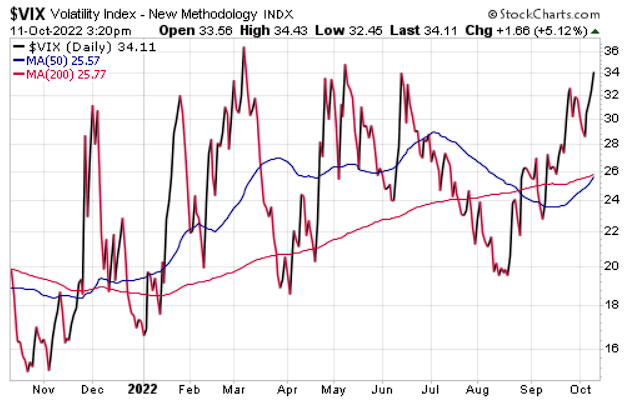
Fast-forward to 2022 and once again, September saw the VIX break through multiple significant downtrend lines, suggesting we may be on the cusp of the final capitulation phase of this bear market cycle. There is no way to confidently forecast how far stocks could fall from current levels, but using the last two major bear markets as a guide suggests that additional losses could be significant.
On the charts, now that the longstanding downtrends in the VIX have been broken, the critical level to watch is the June high of 35.05. A break above there would very likely signal significant pain (borrowing the term from Federal Reserve Chairman Powell) looming in the equity markets.
*****************************************************************
Wednesdays Mean Wisdom
Did you know that Wednesday means wisdom?
Well, not technically speaking, but Wednesdays do mean a fresh dose of wisdom from some of the greatest thinkers the world has ever known, as those thoughts are profiled each Wednesday on my podcast and lifestyle website, Way of the Renaissance Man.

This week’s wisdom is all about harnessing passion, and who better to remind us of how to do that than American novelist, poet, and one of the pioneers of the Beat Generation, Jack Kerouac.
If you want a little dose of inspiration (and who doesn’t?), then check out the newly published Wednesday Wisdom featured right now at Way of the Renaissance Man.
*****************************************************************
On Being Interesting
“Show me a man who’s not interested in the world, and I’ll show you a man who’s not very interesting.”
— Jim Woods
This week’s quote comes from a familiar source: me! This maxim came to me as I was speaking with a friend about the importance of cultivating an interest in a wide variety of subjects. I told him that the key to being a Renaissance Man was to be truly interested in a lot of things. And by cultivating an interest, you learn. And by learning, you also become a person that others find interesting. So, if you want to be interesting, be interested in the world. Besides, being curious and learning is the most fun thing a human can do.
Wisdom about money, investing and life can be found anywhere. If you have a good quote that you’d like me to share with your fellow readers, send it to me, along with any comments, questions and suggestions you have about my newsletters, seminars or anything else. Click here to ask Jim.
![[instant messaging via tablets and phones]](https://www.stockinvestor.com/wp-content/uploads/shutterstock_125411345.jpg)