I provided a brief definition of Return on Invested Capital and explained my preferred method of calculating the ratio in my previous article. After that, I explained my method of creating data tables that I use to evaluate whether the equity will be able to continue paying a dividend distribution in the future. I created a few tables based on data examples and now it is time to analyze the available information, which is the focus of this article.
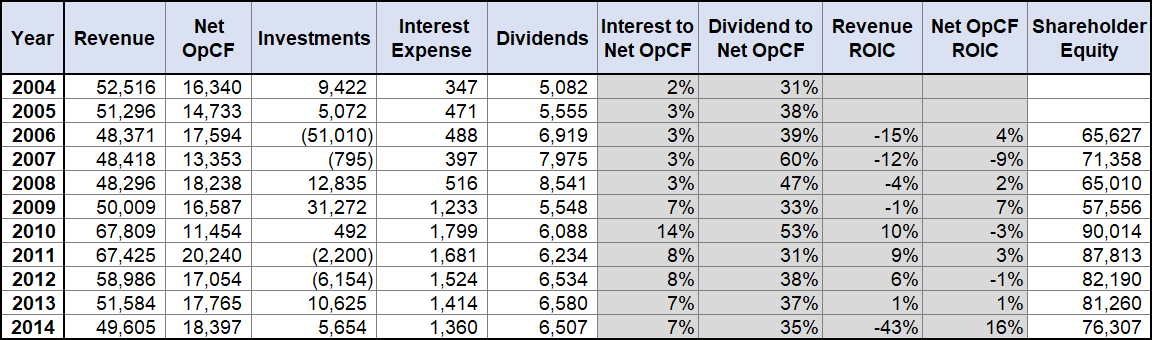
Below is the copy of the example table for WEC Energy Group, Inc. (NYSE:WEC) that I created for the previous article:
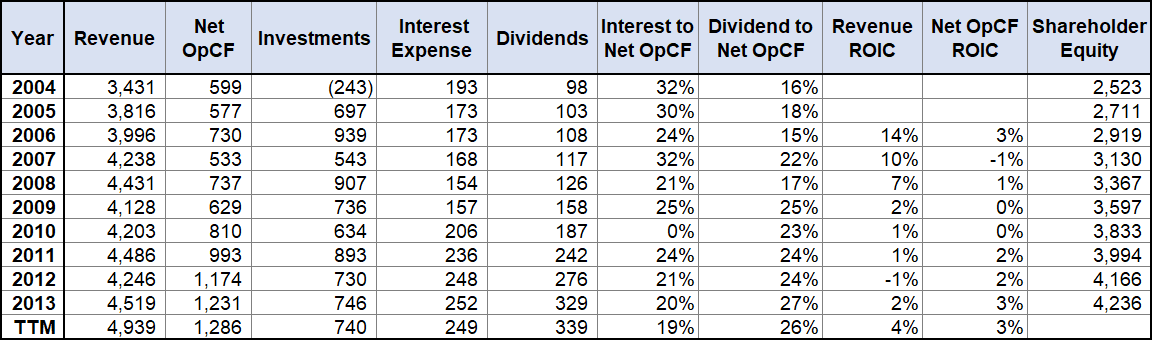
What can we infer from the information in the table above?
- WEC shows an excellent dividend-to-Net Operational Cash Flow payout ratio in the mid-20% range over most of this 10-year history, without any negative trend. Generally, a utility with a dividend-to-Net Operational Cash Flow payout ratio (POR) of less than 50% is satisfactory and less than 30% is very good. Therefore, WEC’s dividend-to-Net Operational Cash Flow ratio is excellent.
- Interest as a percent of the combined Net Operational Cash Flow+Interest of approximately 20% is acceptable. I add back the interest expense to Net Operational Cash Flow because it was previously subtracted. Percentages above 30% for a utility should be a cause of concern. A percentage that high suggests the company is extending itself into excessive debt and putting dividend growth at risk if interest rates rise and decrease the amount of operational cash flow available to pay or grow the dividend.
- The Return on Invested Capital (ROIC) for Revenue and Net Operational Cash Flow are generally improving and at 4.4% and 3.6%, respectively, are very good for 2013 and the first two quarters of 2014. The very slow growth of ROIC for Net Operational Cash Flow for the 2007 to 2010 period would have probably prevented me from investing in WEC in 2009 or 2010. However, if the yield were high enough, I might have purchased a relatively small position and held it in my higher risk income group. Generally, any ROIC growth for Net Operational Cash Flow that is less than 1% per year is a sign the company is struggling to increase cash flow from operations.
I also show shareholder’s net equity for each year in the table above. This information is available at the bottom of the Statement of Financial Position — the Balance Sheet — from where I copy and paste the information into this spread sheet table. Why is this important? Well, as discussed previously, dividends come from the Net Operational Cash Flow. In bad years, a company could pay some of the dividend from borrowed dollars, the issuance of equity or simply from selling company assets. Any of those cases would generally be a bad sign. However, these cases do happen sporadically even with otherwise well-managed dividend-paying companies during tough years, such as deep recessions.
The other potential source of dividend payouts in lean times is shareholder assets — Cash & Cash Equivalents (C&CE) or the sale of assets. This would likely show up as a decline in assets or an increase in liabilities without an associated increase in assets. If this went on for a couple of years or longer, shareholder’s net equity would decline. Now, 99% of companies with growing dividends and a positive ROIC-to-revenue and Net Operational Cash Flow, will also have growing shareholder equity. But it never hurts to keep an eye on the progression of this Generally Accepted Accounting Principles (GAAP) metric.
Let me use additional examples to illustrate a few cases.
Magellan Pipeline Partners (NYSE:MMP)
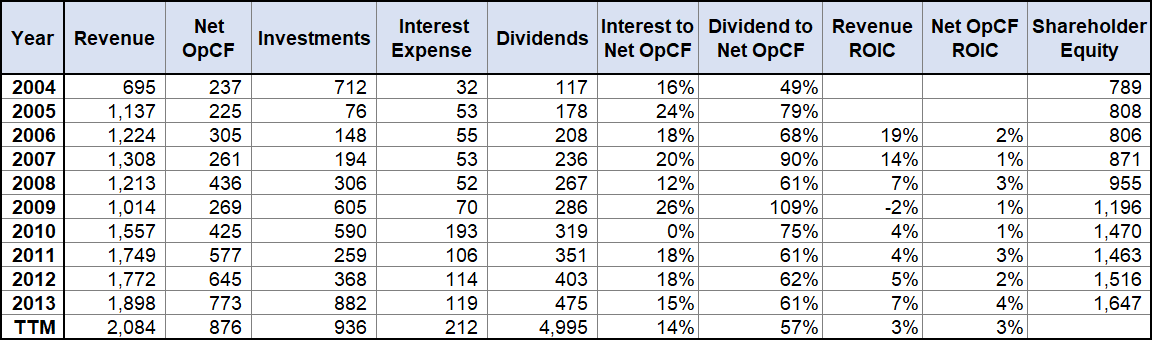
Magellan Pipeline Partners above shows excellent dividend coverage. Since MMP is partnership and not a corporation, the dividend is called a distribution. However, I will refer to these distributions as dividends going forward for the brevity and simplicity. Over the past four years, the Dividend-to-Net Operational Cash Flow payout ratios have been excellent and in the low 60s. Master Limited Partnerships (MLPs) typically have these payout ratio percentages in the mid-80s. Additionally, the ROIC for both revenue and Net Operational Cash Flow is good to excellent. Interest expense has been trending downward, which suggests that MMP is retaining sufficient Net Operational Cash Flow to be able to pay for much of the investing activities without having to employ additional debt. This table above paints a picture of excellent dividend coverage for MMP.
Cincinnati Financial Corporation (NASDAQ:CINF)
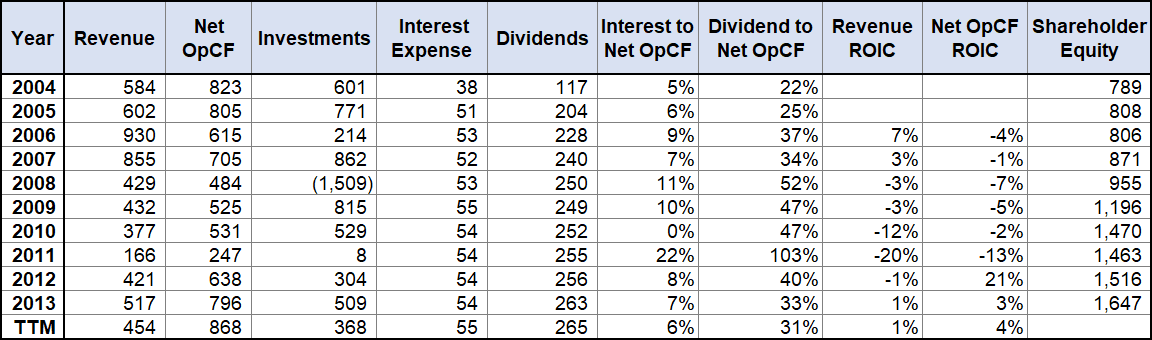
Cincinnati Financial is a commercial property and casualty (P&C) insurance company and carries most assets as insurance capital. Every P&C insurer’s cash flow is at risk based on environmental factors, such as the weather, as well as the economy and can have wider swings in Net Operational Cash Flow than other product driven companies.
Otherwise, dividend coverage analysis for insurance companies is the same as for all other companies. In the example above for the 2008–2011 period, CINF had growing payout ratios, negative revenue and Net Operational Cash Flow ROIC for all years. This would likely have led to a dividend cut for product based companies, MLPs and equity REITs, but did not for CINF. This is likely due to the very low interest expense and the commitment of the insurer to the dividend, as CINF has had a growing annual dividend since 1995.
Pfizer (NYSE:PFE).
Pfizer is a well-known drug manufacturer that had a 24-year history of dividend growth until 2009. From 2004 to 2009 when Pfizer cut its dividend by 50%, dividend-to-Net Operational Cash Flow payout ratio had been increasing each year and ROIC to Revenue was negative for four successive years to 2009 with a large decline in ROIC-to-Net Operational Cash Flow in 2007. Although dividend history was favorable, declining dividend coverage and negative returns to Revenue meant PFE needed to make better investments. These additional investments would require considerable investment capital, which led to the dividend cut.
For all companies in the examples above, the growth in revenue is probably the most sensitive measure of the return on investments. However, rising revenue must also translate into a growing Net Operational Cash Flow. Growing revenue may not translate to a growing dividend if there are other expenses in the company that are consuming the additional revenue funds.
A better measure of investment effectiveness is the growth in Net Operational Cash Flow. I have never seen this metric used and I have no bench marks to compare. However, Revenue Growth-to-Investments greater than 4% per year and a Net Operational Cash Flow growth greater than 2% per year over any five-year period is a positive sign.
To summarize what we gleaned from analyzing the tables above, WEC looks good, MMP looks very good, CINF looks OK and PFE looked poor until it finally got a favorable return to Net Operational Cash Flow in 2014 on its $8.4 billion net investments over the previous five years.
The Return on Invested Capital metric does have its limitations. For example, part of the annual net invested capital may not be accretive to the company’s cash flow, such as maintenance Capital Expenditures. Additionally, recently purchased capital investments may take more time to be accretive and some of the greater increases or decreases in cash flow could be from previous capital investments that were purchased more than five years earlier. Also, a single year’s Net Operational Cash Flow may be artificially low due to a large Accounts Receivable for that particular year, thus making it temporarily smaller than it would be otherwise.
I generally will not consider as income equity any company whose average Net Operational Cash Flow ROIC average five-year growth is under 1% per year for two or more successive years.
An alternative to this calculation is to use published ROIC numbers, such as those provided by Morningstar under the “Key Ratios” tab. However, the published ROIC looks favorable for PFE leading up to the year the dividend was cut.
I will conclude my discussion of equity selection factors for Retirement Income Investors in my next article. In that article, I will explain how to get the dividend information we need from the Internal Revenue Service’s (IRS) 1099DIV form.

Bruce Miller is a certified financial planner (CFP) and retirement income expert who also is the author of Retirement Investing for INCOME ONLY: How to invest for reliable income in Retirement ONLY from Dividends and IRA Quick Reference Guide.