When the major averages are cranking to new all-time highs, it’s an index investor’s dream backdrop for invested capital. And with the S&P and Nasdaq both heavily top-weighted with big-cap tech stocks, it has been a great ride for 2020.
As the wind is to the back of the bulls with the Federal Open Market Committee’s (FOMC) money pushing over-extended stocks even higher, there is one chart that has professional market participants up at night, and with good reason. This graph shows the disparity between where the S&P 500 currently trades and what the index is forecast to earn in 2021.
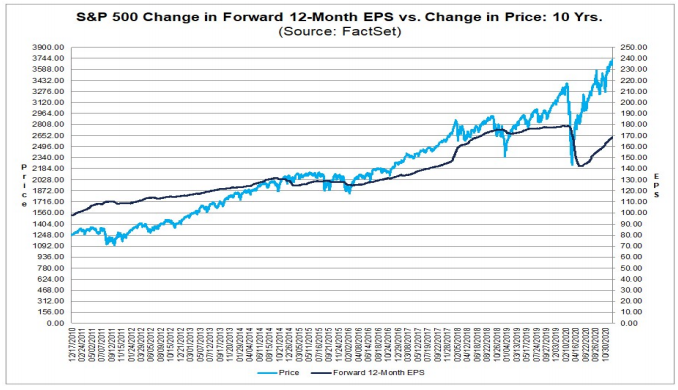
The latest estimate is that forward 12-month earnings per share (EPS) for the S&P is $175, representing a solid rebound from this year’s depressed levels, but still below that of 2019. The forward 12-month price-to-earnings (P/E) ratio for the S&P 500 is 22.1. This P/E ratio is above the five-year average of 17.4 and above the 10-year average of 15.7. (source: FactSet Earnings Insight)
There is great psychological stock being placed in the fact that the latest earnings forecasts for 2021 are going to be on the light side, and that might well be true. Looking at the chart above, much work has yet to be done for the S&P earnings model if it is to catch up and close the wide gap between the price and earnings disparity that currently exists.
Just as an observation, it seems that, for the past two decades, there has been a modern template of rationalizing stocks with non-existent P/E ratios that the market is highly comfortable with. In my view, it emanates from Amazon.com (AMZN).
For many investors, both professional and retail, this company and its stock performance changed the rules of growth investing in a way that has had a deep impact on the notion of buying stocks with moonshot valuations.
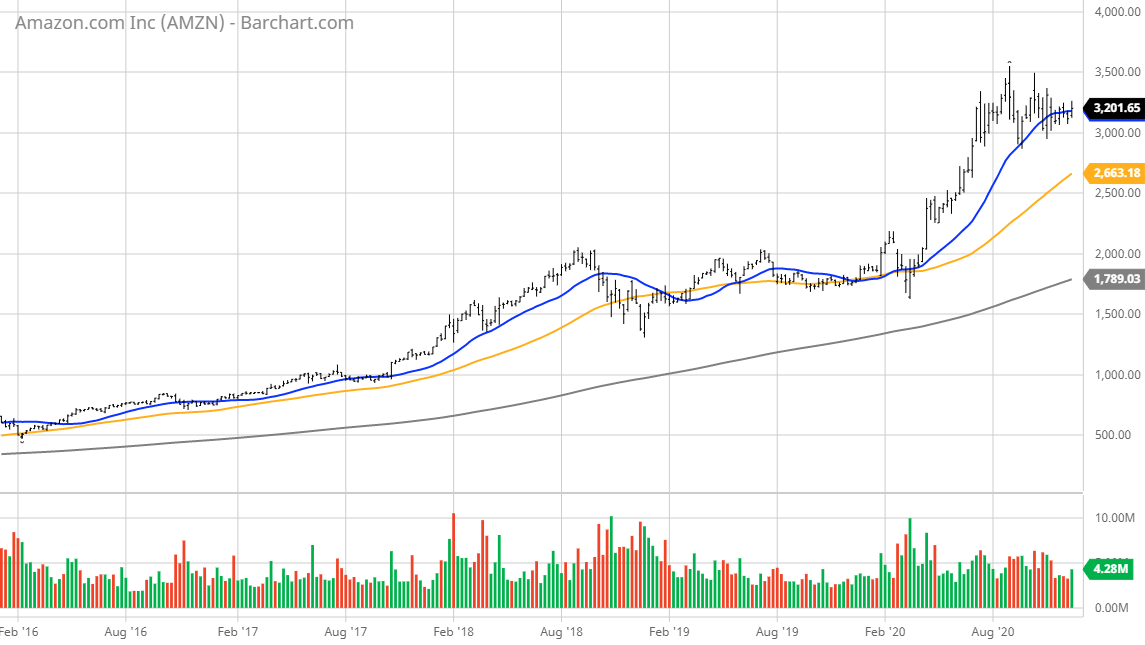
The company has enjoyed a sky-high valuation for several years, with torrid revenue growth keeping investors piling into the stock with the understanding that, at some point, Amazon would monetize its business model. And indeed, the company has started to do so as of a couple years ago. In the meantime, the stock has gained roughly 545% in the past five years.
From the tables provided below, Amazon’s stock price, sales per share, price to sales ratio, trailing 12-month earnings and quarterly earnings trends are visible. This might be considered the quintessential picture of a hyper-growth stock that scaled beautifully into its monetization maturity.
Amazon’s earnings are forecast to rise to $45.38 per share in 2021, based on the forecasts of 47 analysts, implying the stock trades at a forward P/E of 71X. That valuation is far from cheap, but certainly not expensive, given its growth rate and dominant position. The stock commands and deserves a serious premium.
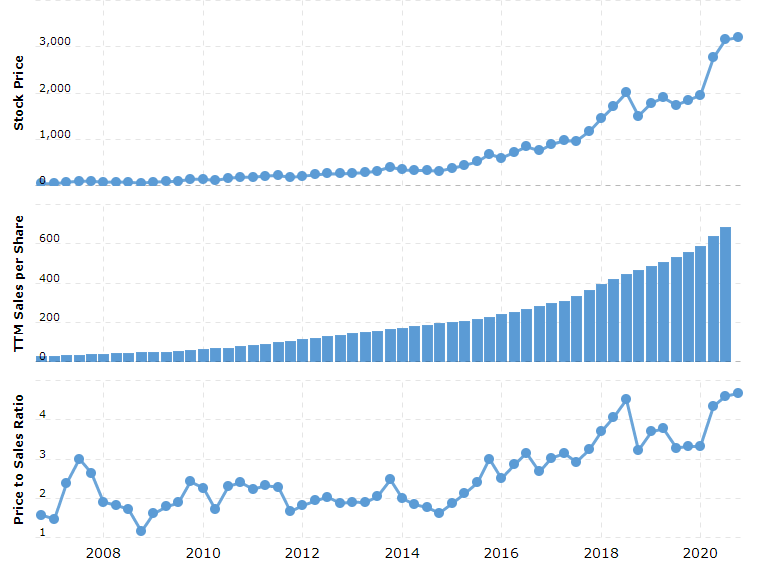

Source: macrotrends.net
Many of today’s “cloud king” stocks, electric vehicle (EV) stocks, renewable energy stocks, artificial intelligence (AI) semiconductor stocks and cannabis stocks trade with similar promise, and are characterized by quantum revenue growth and future exponential earnings growth prospects.
The only difference between the Amazon stock of five years ago and today’s white-hot growth stocks is that, during the past 15 years, Amazon never traded with a price to sales (P/S) ratio of greater than 5X. Many of today’s hottest stocks with market caps in the tens of billions of dollars trade with a P/S of 20-200X — a metric once reserved for only the biotech sector.
Forget earnings per share (P/E) ratios. When there’s no net income, there is no P/E ratio. And for most investors with any experience, forgiving share valuation based on P/E ratios is quite common. However, buying stocks with sky-high P/S ratios is another thing and smacks of the dot.com valuations.
A recent case in point is the initial public offering (IPO) of Snowflake Inc. (SNOW). It trades with a market cap of $94.6 billion and annual sales of $580 million for 2020. This translates to a P/S ratio of 163X. ($94.6 billion /$580 million = 163 P/S). Even if the company does grow forecasted revenue by 90% in 2021 to $1.1 billion, that is still a forward P/S of 86X.
The reason SNOW was priced at $120 is because its investment bankers were already pricing the stock with a P/S of 60X on day one of trading in what would normally be considered a stock that was priced to perfection. It is this kind of disregard for this key valuation metric that will, at some point, be problematic for those investors who have bought into the “sky is the limit” narrative for stocks like Snowflake and others that are too numerous to mention.
This year’s “hotties” will, at some point, undergo mean reversion to where valuations are better understood to be rational. This reversion back to the mean could occur in early 2021, if the current broadening out of the market draws from the highly weighted tech sector. This is where a lot of new, and seemingly inexperienced money (Robinhood’s young-adult investors, for example), is committed.
If and when the S&P and Nasdaq suffer the next 10% correction and, rest assured, it will happen, the stocks with stratospheric P/S ratios will get cut in half. In many cases, the stocks will fall by even more.
Unless one is in for the multi-year ride with the intention of buying more of the same stocks on huge pullbacks to dollar-cost average, then it stands to reason that booking profits or placing some tight stops on stocks priced to infinity and beyond makes good sense in a market that is getting technically overbought.
As an FYI, Amazon priced its IPO at $18 in 1997 with annual sales of $857 million (+1,428% year over year) and sporting a P/S of 15X. The rest is history. Going through a garden variety 10% correction is bearable for most investors, and the next one will probably come without much notice, just like the last three corrections of 2020. The first one in March was a 30% doozie.
Getting crushed by 50% or more on open positions is not okay, because it means that stocks have to double just to get back to even. Playing with high P/S stocks can result in third-degree burns in one’s portfolio. Take heed and protect your gains in stocks that resemble roman candles, because invariably, they all flame out, and you can always buy them back when they are on sale.


![[instant messaging via tablets and phones]](https://www.stockinvestor.com/wp-content/uploads/shutterstock_125411345.jpg)